In previous CAPA Corner blogs, we discussed a model for conducting a science-based systematic investigation, and the importance of understanding the problem and ensuring you have all the facts, before conducting a root cause investigation.
The third step of the investigation is to develop a list of possible causes. All too often investigators stumble at this point as they rely solely on the fish-bone diagram. While the fish-bone is an excellent tool, there are other techniques that are more powerful. Two of these are illustrated below.
I’ll continue with the “widget” example. The widget is assembled, placed into a pouch, the pouch sealed, and the batch sterilized and released. Customers are complaining that some pouches are open upon receipt. As a result the firm tested the pouch seal strength and found that some pouches are failing the minimum seal strength requirements.
Technique: Looking for differences
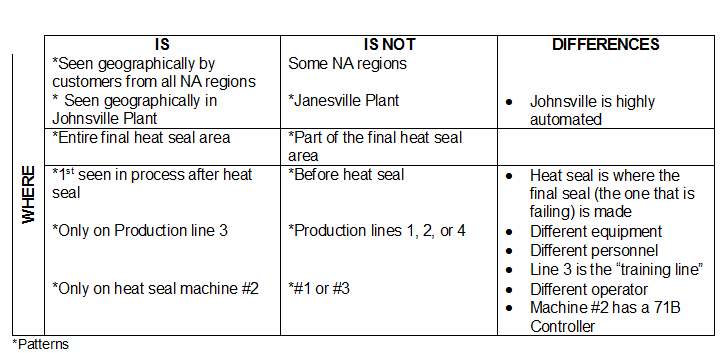
The first technique is identifying differences between the IS and IS NOT data. To illustrate let’s return to the fact based IS / IS NOT Diagram for the “Where” questions (See Figure A).

For each IS / IS NOT entry we ask, “What is different about the IS compared to the IS NOT?” For the first entry this translates to, “What is different about all North American sales regions compared to only some regions?” Here the investigator doesn’t find any differences. This is not unusual. However, you always ask the question and, if differences are found, they are recorded. Each difference is a possible cause.
Next we address the second set of data. What is different about the Johnsville Plant compared to the Janesville Plant? Here a difference is found! The Johnsville facility is the primary manufacturing plant and is highly automated. The Janesville Plant is a pilot operation with mostly hand-assembly work. Remember, our investigation is searching for a change that caused the pouch seal failures. By recording, in Figure B, that Johnsville is highly automated we are suggesting that there may have been a change in some of that automation resulting in pouch seal failures. If there has been a change in the automated equipment this would at least explain the fact that the issue is only observed in Johnsville and not in Janesville.
We would look for differences in the remaining IS / IS NOT entries. For example, the last IS / IS NOT entry indicates that the defect is only coming from heat seal machine #2 and not from the other two machines on the production line. Again we ask, “What is different about machine #2 compared to machines #1 and #3?” Differences found are that the operator on machine #2 is obviously different. Perhaps the operator of Machine #2 has changed and was trained differently than in the past. Another difference is Machine #2 has a different controller than the other two machines. Perhaps this 71B controller has been changed recently and is causing the weak and open seals. The differences are recorded and each difference is a possible cause.

Technique: Timeline of changes
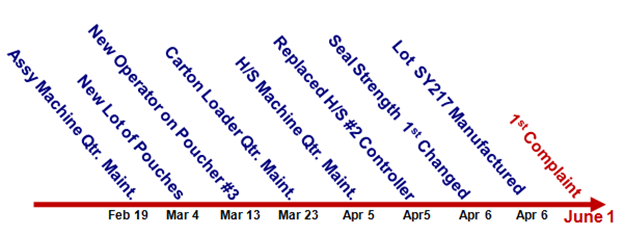
Another excellent technique for identifying possible causes is to develop a timeline of changes. We realize that any time a change is made in our equipment, materials, operations, procedures, etc., there are opportunities for unintended consequences. It’s possible that a change intentionally made in the production area caused the seal issue. We therefore assemble a list of all known changes that have been made and organize them on a timeline in a time-ordered fashion. See Figure C.

The first complaint of open seals was received on June 1. The lot that received the first complaint was produced on April 6. We have made a list of all the changes that we are aware of that impacted the production line starting on April 6 and working back in time.
Now I’m going to change our story a bit to illustrate a point. We’re going to say that a control chart was being maintained to monitor seal strength. Every hour, samples were pulled at the end of the production line, seal strength was measured, and the control chart updated. When reviewing the control charts we notice that seal strength went beyond the lower control limit for the first time on April 6th beginning with the samples pulled at 10 AM. The other entries are changes that were made at or before 10 AM on April 6. Each change is a possible cause of our issue. For example, on April 5th, the night before the first bad lot was produced, there were two changes made on the production line:
- Quarterly maintenance was performed on all the heat seal machines.
- With that maintenance the controller on heat seal machine #2 was replaced with a 71B controller.
We will certainly take a close look at any change made directly before the commencement of change in performance, but we will continue to investigate all the other changes listed on the timeline. Often there is a delay between a change and the onset of the symptoms. All these changes are possible causes of our problem.
Summary
We quickly explored two techniques for initiating a list of possible causes. Neither is a brainstorming exercise. I have found both to be quite potent tools for coming up with a good list of possible causes during an investigation.


